Drawing Georeferenced Graphs - Combining Graph Drawing and Geographic Data
 A georeferenced graph with
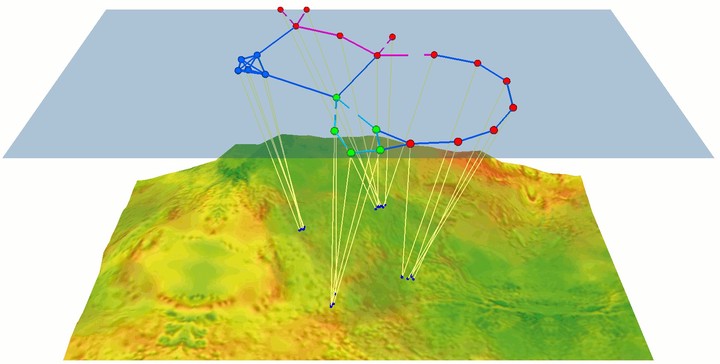
 23 entities and 32 links
Abstract
We consider the task of visually exploring relationships (such as established connections, similarity, reachability, etc) among a set of practical solution based on separating and then integrating back again the networked and geographical dimensions of the input dataset. This allows us to easily cope with partial or incomplete geographic annotations, to reduce cluttering of close entities, and to address focus-plus-context visualization issues. Typical application domains include, for example, coordinating search and rescue teams or medical evacuation squads, monitoring ad-hoc networks, exploring location-based social networks and, more in general, visualizing relational datasets including geographic annotations.
Giordano Da Lozzo
Assistant Professor (RTDb)
My research interests are in Algorithm Engineering and Complexity, focused in particular on the theoretical and algorithmic challenges arising from the visualization of graphs.