Information Visualization Program and Slides
|
Course Introduction12-Mar-2018, Maurizio Patrignani Click to download: 010-presentation-05.pdf [5.4 MB] Teachers. Program. Exams. Data overloading. Comparison of Scientific Visualization and Information Visualization. First examples of visualization. Lectures ahead. |
|
Data and Information14-Mar-2018, Maurizio Patrignani Click to download: 020-data-model-04.pdf [600 KB] Structured and Unstructured data. Data transformation. Data tables. Examples data modeling and visualization. |
|
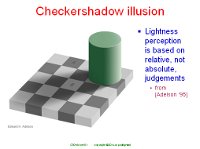
Visual Perception19-Mar-2018, Maurizio Patrignani Click to download: 030-vision-04.pdf [1.6 MB] Our vision’s principles and limitations. Peripheral and central view. Edge detection mechanisms. Perception and illusions. |
|
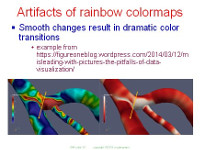
Perception of Colors19-Mar-2018 and 21-Mar-2018, Maurizio Patrignani Click to download: 040-color-03.pdf [2.8 MB] The perception of color. Chromatic aberration. Color perception. Color spaces. Colormaps. |
|
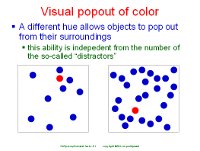
Perception and Cognitive Issues26-Mar-2018, Maurizio Patrignani Click to download: 050-perception-02.pdf [1.9 MB] Perception abilities. Weber's law. Stevens' power law. Gestalt laws. A two stage model for visual perception: preattentive processing. |

|
Multivariate Data Representations28-Mar-2018 and 11-Apr-2018, Maurizio Patrignani Click to download: 060-multivariate-05.pdf [4.4 MB] Combined views (multiple bars, stacked bars, multiple views, table lens, scatterplot matrix). Icons or glyphs (Chernoff faces, multidimensional icons). Alternative coordinate systems (parallel coordinates, star plots, star coordinates). |
|
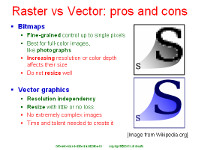
Infovis on the Web - SVG04-Apr-2018, Giordano Da Lozzo Click to download: 070-web-dev-04.pdf [630 KB] Basic ingredients of Web data visualization. JavaScript crash course. Raster and vector graphics (properties, pros and cons). Properties and examples of SVG and HTML5 Canvas. |
|
Infovis on the Web - D3.js09-Apr-2018, Giordano Da Lozzo Click to download: 080-hands-on-d3-js-04.pdf [817 KB] Overview of JavaScript libraries. Focus on D3.js: installation, usage, tools from probability theory, other utilities, objects conversion, maps, sets, array operators, scales, example application. |
|
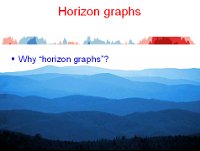
Visualization of Time Series Data11-Apr-2018 and 16-Apr-2018, Maurizio Patrignani Click to download: 090-timeseries-05.pdf [3.5 MB] Definition of time series and temporal data. Visualization of time series (single dependent variable, multiple dependent variables). Examples and case studies. |
|
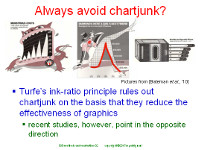
Design Methods, Tasks, and Evaluation16-Apr-2018 and 23-Apr-2018, Maurizio Patrignani Click to download: 100-methods-tasks-evaluation-05.pdf [1.5 MB] Design methodologies and design choices. User tasks. Evaluation and validation (goals, difficulties, practices, guidelines). |

|
Interaction23-Apr-2018 and 2-May-2018, Maurizio Patrignani Click to download: 110-interaction-05.pdf [2.7 MB] Classification of interaction mechanisms, goals, and timings. Examples of interaction strategies. |
|
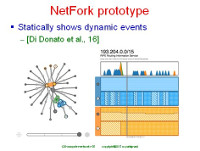
Visualization in Computer Networks2-May-2018 and 7-May-2018, Maurizio Patrignani Click to download: 120-computer-networks-06.pdf [4.1 MB] Visual analysis in the computer network domain. Motivations. Taxonomies (by stakeholder, by network abstraction, by data source). Real-world examples and use cases. Open problems. |
|
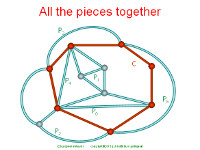
Graph Drawing: An Introduction7-May-2018 and 9-May-2018, Maurizio Patrignani Click to download: 130-graph-drawing-03-senza-risposte.pdf [1.7 MB] Graph Drawing. Graph Drawing conventions and aesthetics. The divide an conquer approach for testing planarity of a graph. |
|
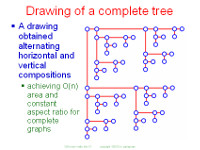
Node-link Representations of Trees9-May-2018 and 14-May-2018, Maurizio Patrignani Click to download: 140-trees-node-link-02.pdf [630 KB] Representing trees within the node-link paradigm. Layered drawings of trees. Hv-drawings of trees. |
|
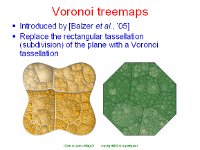
Implicit Representations of Trees14-May-2018, Maurizio Patrignani. Click to download: 150-implicit-tree-representations-04.pdf [3.2 MB] Limitations of node-link representations. Algorithms and systems for visualizing trees using implicit representations. Treemaps (nested treemaps, cushion treemaps, cluster treemaps, squarified treemaps, ordered treemaps, quantum treemaps, Voronoi treemaps, and circular treemaps). 3D Space-filling approaches. |
|
Representations of Graphs and Networks with the Force-Directed Approach (Part I)16-May-2018, Maurizio Patrignani. Click to download: 160-force-directed-first-04.pdf [2.7 MB] The force-directed paradigm. The barycenter method. Spring embedders. |
|
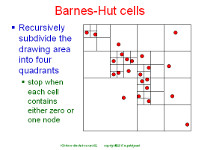
Representations of Graphs and Networks with the Force-Directed Approach (Part II)21-May-2018, Maurizio Patrignani. Click to download: 170-force-directed-second-06.pdf [890 KB] Scalability and flexibility of the force-directed paradigm. Fruchterman-Reingold and Barnes–Hut algorithms. Simulating graph theoretic distances. Magnetic fields. Generic energy functions. Handling drawing constraints. |
|
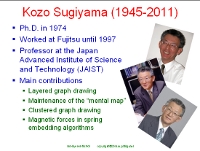
Representations of Hierarchical Data (Part I)23-May-2018 and 30-May-2018, Maurizio Patrignani. Click to download: 180-layered-first-05.pdf [3.6 MB] Algorithms for the representation of layered networks. The Sugiyama approach. Step 1: Cycle removal. Step 2: Level Assignment |
|
Representations of Hierarchical Data (Part II)30-May-2018 and 03-Jun-2018, Maurizio Patrignani. Click to download: 190-layered-second-04.pdf [1.2 MB] Algorithms for the representation of layered networks. The Sugiyama approach. Step 3: Crossing Reduction. Step 4: X-Coordinate Assignment |
|
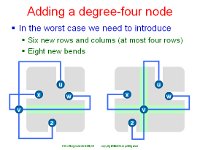
Orthogonal Drawings (via Network Flows)03-Jun-2018 and 06-Jun-2018, Maurizio Patrignani. Click to download: 200-orthogonal-flow-04.pdf [3.5 MB] Algorithms for the representation of orthogonal drawings. The Topology-Shape-Metric approach. Extension to graphs of arbitrary degree |
|
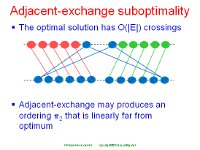
Orthogonal Drawings (via Visibility Representations and Incremental Algorithms)6-Jun-2018 and 11-Jun-2018, Maurizio Patrignani. Click to download: 210-orthogonal-visibility-03.pdf [680 KB] Representations of orthogonal drawings obtained from visibility representations and by incremental approaches. |
|
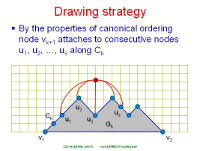
Straight-Line Grid Drawings11-Jun-2018, Maurizio Patrignani. Click to download: 220-straight-line-grid-03.pdf [680 KB] Strategies for obtaining straight-line drawings of planar graphs in the grid. Canonical orderings. The shift method of de Fraysseix-Pach-Pollack and the realizer method of Schnyder. |
|
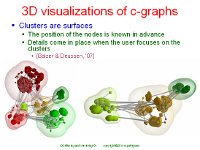
Visualizing Large Graphs13-June-2018, Maurizio Patrignani. Click to download: 230-large-graphs-06.pdf [3.2 MB] Strategies for the visualization of massive amount of data providing both overview and details. Alternate between views. Combine different views. Filtering and clustering principles. Three-dimensional and two-dimensional representations of clustered graphs. Hybrid representations. |