
Graph Drawing Toolkit
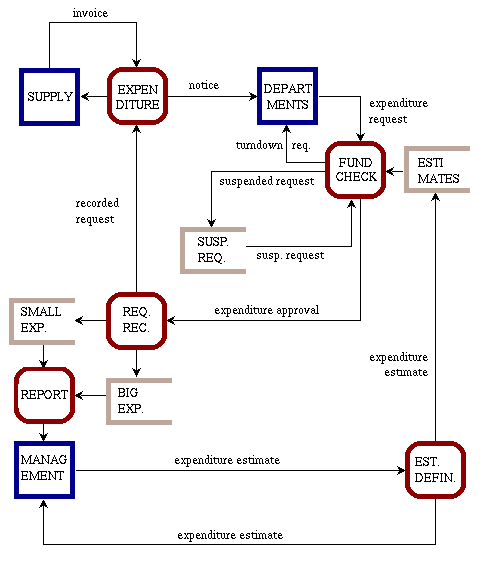
| Sample ApplicationsData Flow diagramsData Flow diagrams are widely used in software engineering, information systems, and data base design. They represent processes and flows of data between processes. They have three types of symbols. Namely, interfaces, repositories, and processes. Interfaces represent the "boundaries" of the system. Repositories represent information stored in the system. Processes represent agents (for example SW modules) that elaborate information. Interfaces, processes, and repositories are usually represented as squares, smoothed squares, and right-open rectangles, respectively. Connections between symbols are usually "directed". The arrow along a connection illustrates the direction of the flow of information.Speaking in terms of graph properties, Data Flow diagrams are directed graphs. We suggest to represent Data Flow diagrams with orthogonal drawings, i.e., drawings in which the connections between symbols consist of horizontal and vertical segments only. The following figure shows an example of Data Flow diagram constructed with GDT. GAPI tutorial on orthogonal drawings and BLAG tutorial on orthogonal drawings provide a comprehensive guide on how to use GDT to construct these widely used drawings.
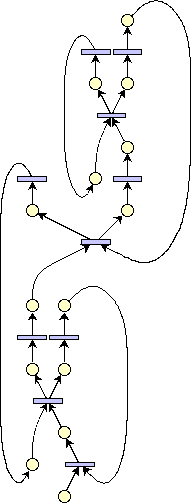
Petri netsA Petri Net consists of a set of places, a set of transitions and a set of edges connecting places to transitions and transitions to places. It can be seen as a condition/event graph, where places are conditions and transitions are events. An event can occur if all conditions for the event hold. Places are usually represented as small circles while transitions are represented as thick lines. Usually, an edge enters a symbol from bottom to top.Speaking in terms of graph properties, Petri Nets are directed graphs. We suggest to represent Petri nets with upward drawings, i.e., drawings in which the edges tend to flow, as much as possible, in a common direction. Also, for Petri nets we suggest to represent edges with smoothed lines. The following figure shows an example of a Petri net constructed with GDT. GAPI tutorial on upward drawings and BLAG tutorial on upward drawings provide a comprehensive guide on how to use GDT to construct these widely used drawings.
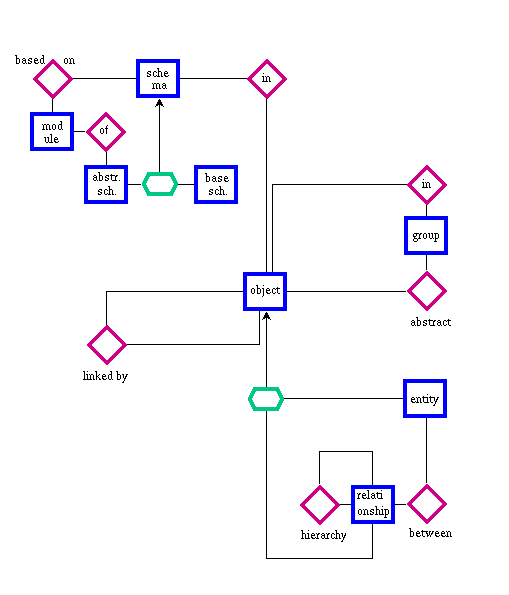
Entity-Relationship diagramsEntity-Relationship diagrams are widely used in conceptual modeling and data base design. They represent objects (entities) and relationships between objects. They have two types of symbols. Entities and relationships are usually represented as rectangles and diamonds, respectively. Connections between symbols are usually "undirected".Speaking in terms of graph properties, Entity-Relationship diagrams are undirected graphs. We suggest to represent Entity-Relationship diagrams with orthogonal drawings, i.e., drawings in which the connections between symbols consist of horizontal and vertical segments only. The following figures show examples of Entity-Relationship diagrams constructed with GDT. GAPI tutorial on orthogonal drawings and BLAG tutorial on orthogonal drawings provide a comprehensive guide on how to use GDT to construct these widely used drawings.
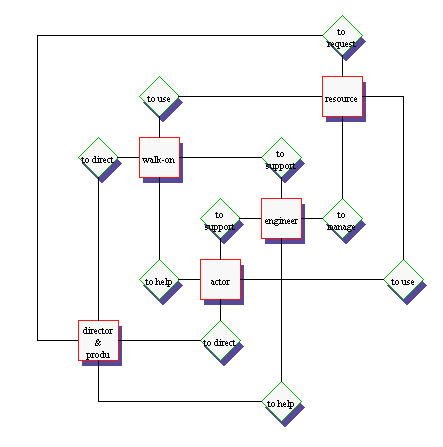
Pert diagramsThe following figure shows an example of a Pert diagram constructed with GDT.GAPI tutorial on upward drawings and BLAG tutorial on upward drawings provide a comprehensive guide on how to use GDT to construct these widely used drawings.
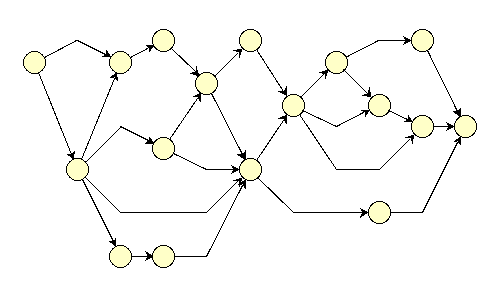
Another possibility is to represent Pert diagrams with visibility drawings. GAPI tutorial on visibility drawings and BLAG tutorial on visibility drawings provide a comprehensive guide on how to use GDT to construct these widely used drawings. Ownership diagramsOwnership diagrams are used in the stock market to represent ownership relationships between companies. Companies are represented as boxes. An edge from Company 1 to Company 2 means that Company 1 owns a certain percentage of Company 2.Speaking in terms of graph properties, Ownership diagrams are directed graphs. We suggest to represent Ownership diagrams with orthogonal drawings, i.e., drawings in which the connections between symbols consist of horizontal and vertical segments only. GAPI tutorial on orthogonal drawings and BLAG tutorial on orthogonal drawings provide a comprehensive guide on how to use GDT to construct these widely used drawings. State-transition diagramsState-transition diagrams (also called deterministic finite automata) are widely used to represent the behavior of systems. States are usually represented as small circles and (possible) transitions between states are represented by directed edges.Speaking in terms of graph properties, State-transition diagrams are directed graphs. We suggest to represent State-transition diagrams with upward drawings, i.e., drawings in which the eges tend to flow, as much as possible, in a common direction. Also, for State-transition diagrams we suggest to represent edges with smoothed lines. The following figure shows an example of a State-transition diagram constructed with GDT. GAPI tutorial on upward drawings and BLAG tutorial on upward drawings provide a comprehensive guide on how to use GDT to construct these widely used drawings. 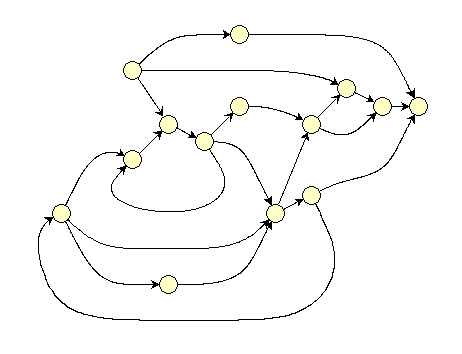
Another possibility is to represent State-transition diagrams with polyline drawings, i.e., drawings. GAPI tutorial on polyline drawings and BLAG tutorial on plyline drawings provide a comprehensive guide on how to use GDT to construct these widely used drawings. Computer networksComputer network schematics are used to represent Local Area Networks and their interconnections. Nodes may represent hosts, terminals, printers, routers, hubs, switches, bridges, and repeaters. Edges represent phisical links between such devices and are to be considered "undirected".Speaking in terms of graph properties, computer networks are undirected graphs. We suggest to represent Computer networks with orthogonal drawings, i.e., drawings in which the connections between symbols consist of horizontal and vertical segments only. GAPI tutorial on orthogonal drawings and BLAG tutorial on orthogonal drawings provide a comprehensive guide on how to use GDT to construct these widely used drawings. The following figure shows an example of Computer network diagram. 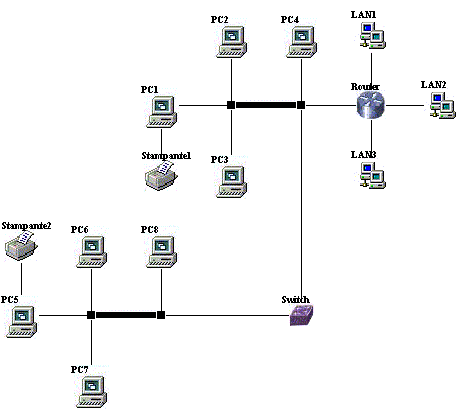
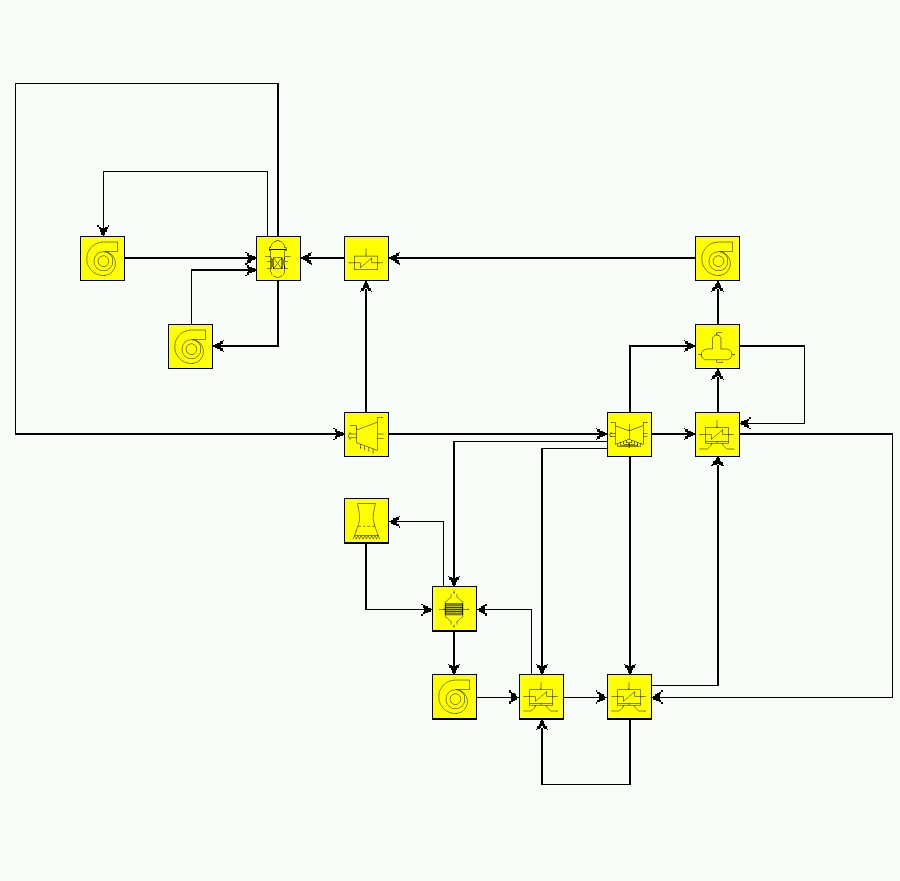
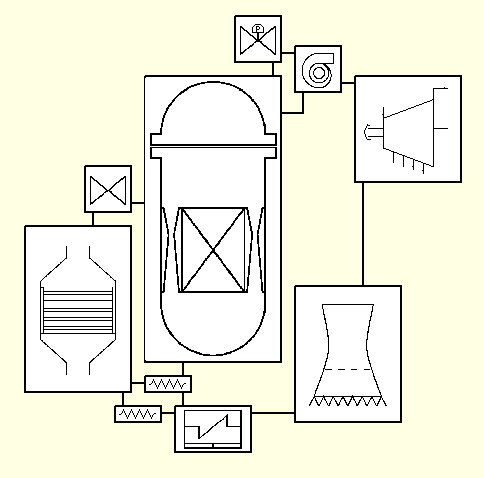
Industrial diagramsIndustrial diagrams are used to give high level descriptions of industrial systems. Nodes may represent pumps, gas and steam turbines, heat-exchangers, degasers, reactors, boilers, steam condensers, etc. Edges represent phisical links between such devices and are to be considered "directed" following the normal flow of the fluids.Speaking in terms of graph properties, Industrial diagrams are directed graphs. We suggest to represent Industrial diagrams with orthogonal drawings, i.e., drawings in which the connections between symbols consist of horizontal and vertical segments only. GAPI tutorial on orthogonal drawings and BLAG tutorial on orthogonal drawings provide a comprehensive guide on how to use GDT to construct these widely used drawings. If you want to give a look at an example of Industrial diagram constructed with GDToolkit, click here and here. Bayesian belief networksBayesian belief networks are used to model application domains that are characterized by inherent uncertainty. The nodes of the network represent random variables, and the edges represent probabilistic dependencies between variables.Speaking in terms of graph properties, Bayesian belief networks are directed acyclic graphs. We suggest to represent Bayesian belief networks with upward drawings, i.e., drawings in which the eges tend to flow, as much as possible, in a common direction. Also, for Bayesian belief networks we suggest to represent edges with smoothed lines. GAPI tutorial on upward drawings and BLAG tutorial on upward drawings provide a comprehensive guide on how to use GDT to construct these widely used drawings. Influence diagramsInfluence diagrams are bayesian belief networks equipped with decisions and utilities. An edge from a random variable to a decision variable indicates that the value of the random variable is known when the decision will be taken, and an edge from one decision variable to another indicates the chronological ordering of the corresponding decisions.Speaking in terms of graph properties, Influence diagrams are directed graphs. We suggest to represent Influence diagrams with orthogonal drawings, i.e., drawings in which the connections between symbols consist of horizontal and vertical segments only. GAPI tutorial on orthogonal drawings and BLAG tutorial on orthogonal drawings provide a comprehensive guide on how to use GDT to construct these widely used drawings. |
Last update: February 08, 2008